According to Trulia, men have 7% more homes for sale than women.
Yet women's listings are 15% more expensive...


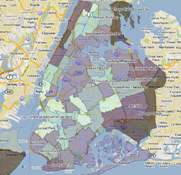
Search all of New York City's affordable housing by name, owner, year built, location, financing or physical information (for example by # of building violations in 2010). Or, you can research all sorts of demographic information from Crime to Education to employment to health to all sorts of housing informtion, to property tax to population, ethnic demographics and transportation.
The Furman Center for Real Estate and Urban Policy collects a broad array of data on demographics, neighborhood conditions, transportation, housing stock and other aspects of the New York City real estate market. We make our data directly available to the public through our new Data Search Tool, and publish comprehensive analyses of these data in our periodic reports.
The Data Search Tool is a new online application that provides direct access to New York City data collected by the Furman Center. Users can select from a range of variables to create customized maps, download tables, and track trends over time. Users are able to overlay never-before available information on privately-owned, publicly -subsidized housing programs collected through the Furman Center’s Subsidized Housing Information Project (SHIP). Information about how to use the Data Search Tool is available in our online guide.
From the Furman Center


Most entrepreneurs think about the color of their site in terms of how colors look together and whether they’re generally appealing, but color actually has a lot more to do with what your visitors think about your site – and the actions they take – than you might realize.There have been entire books written about the psychology of color in buying habits. It’s a topic that has been well studied, and most marketing degrees include at least some study of this topic. We don’t want to bore you with psychology talk though. So here are the basics of what various colors mean, who they appeal to, and who should use them.
First, a Few Stats
Some of these statistics have to do with the color of individual products, but they demonstrate very clearly the power color has in the minds of consumers. According to a recent KISSMetrics report:
- 93% of consumers place color and appearance above other factors when making a buying decision.
- 85% of shoppers state color as the primary factor in their decision to buy a product.
- Brand recognition, which links directly to consumer confidence, is increased by 80% when the right colors are used.
What Does it Mean?
It’s important to know what specific colors mean to people. It’s been shown that certain colors invoke specific feelings in most people, so let’s see what colors really mean.
Yellow: Youthful and optimistic. Use it to grab attention. Usually not good as a background or primary site color.
Red: Energy. Creates urgency and increases heart rate. Good for appealing to impulse shoppers.
Blue: Creates feelings of trust and security. This is why many banks use it in their logos or marketing. Navy or dark blue is used to market to the budget-conscious.
Green: Gives the impression of wealth. Relaxing and easy-going. Teal can be used to appeal to people on a budget.
Orange: Aggressive and excitement. Good for calls to action and impulse buying.
Pink: Feminine and romantic. Used to market to women and girls and traditional buyers.
Black: Powerful and sleek. Use it to market luxury products and appeal to impulse buyers.\
Purple: Soothing and calming. Often used to market anti-aging products.
Part of the study mentioned above found that what your site visitors see when they come to your site, from overall design to the colors used, really does make an impact on whether they buy from you. In fact, 52% of people surveyed who said they would not return to a site stated the reason as ‘aesthetics.’ If there was ever any question, that should confirm that the look of your site is one of the most important parts of your business.
Marketers have built a temple that needs to be torn down. Demographics have defined the target consumer for more than half a century — poorly. Now, with emerging interest graphs from social networks, behavioral data from search outlets and lifecycle forecasting, we have much better ways of targeting potential customers.
The rise of mass-produced consumer goods also brought the rise of mass-market advertising. In the 1950s and 1960s, the goal of television was to aggregate the most possible eyeballs for advertisers. In order to convince consumers that an advertising message was relevant to them, consumers had to buy the idea that they were just like everyone else.
Marketers created that buy-in by bucketing people into generations. When you lump 78 million people into one group called “Baby Boomers,” it’s much easier to sell them stuff, especially when consumers accepted their generational classification.
But now, that entire system has broken down. The year that someone was born will not tell you how likely he is to buy your product.
Fragmentation is now the norm because the pace of change is accelerating. Generations have been getting smaller because there are fewer unifying characteristics of young people today than ever before:
With the recent rise of the social web, people self-select into groups so small, so fragmented, and so temporal, that no overarching top-down approach could be successful at driving marketing performance.
Marketers have responded by adding more demographic information to the mix, but even that is a losing battle. I worked with one client who was introducing a technology product, and had identified a target market of “connected consumers.” Connected consumers were 34-55, had a household income over $120k, and read technology publications regularly. This target market represented 14 million consumers.
They were targeting 14 million consumers to sell 50,000 units — that means they were hoping for 3.5 sales for every 1,000 people with whom they connected through their marketing.
What if, instead, you could get 500 sales from every 1,000 people you marketed to?
It’s possible through psychographic profiling. Psychographics look at the mental model of the consumer in the context of a customer lifecycle. Amazon.com has long been a leader in this space, through innovations like “recommended products” and “users like me also bought.” Its algorithms have learned to predict its users, and what they are interested in. And now, there are a number of tools that any business can use to leverage psychographics.
Here’s how a psychographic profile might look different from a traditional marketing profile target for a childcare provider:
Psychographics provide much more useful information about users. There are multiple data sources making this possible today. Social profile data, behavioral data and customer lifecycle data can now finally be leveraged to contact people who are ready to buy.
Social Profile Data
Profile data from social networks consist of all the fields users grant permission for brands to use on their behalf. Most things that users track on social networks can be leveraged to create a closer relationship with a customer. Fields like relationship status, alma mater, interests and occupation can all be managed through social profile data management tools.
Social profile data is the critical cornerstone of psychographic insights. The level of nuance and insight provided by social data, when compared to standard demographics, is the difference between performing surgery with a scalpel or a butter knife. Previously unimaginable questions are now routine:
- Are customers who kayak more likely to buy water shoes than those who canoe?
- Who is more likely to spend over $100 on an order: Seattle Seahawks fans or Seattle Mariners fans?
- Are your customers more likely to purchase when they move across the state or across the country?
In addition, companies such as GraphEffect are measuring purchase intent by doing semantic analysis on Facebook status updates. This type of qualitative analysis can move users into specific marketing funnels from their very first online experience with your brand.
Behavioral Data
Retargeting advertising messages is gaining popularity among marketers, but its very success has jeopardized its effectiveness. Ads that follow users around the web have been implemented — usually poorly. Every ad network quickly incorporated the ability to place cookies in users’ browsers, and display specific ads to them any time they visit a site that’s part of their networks.
The next generation of ad targeting will focus more on telling the customer a story over time, based on specific behavior triggers. That means ad networks and clickstream data aggregators will work together to trigger when a customer moves forward in a mental model toward a purchase event.
Site content and product recommendations will also be informed by clickstream analysis. Companies such as RichRelevance, Certona, Baynote and Monetate all offer the ability to personalize information to specific visitors based on their behavior. Leveraging those alongside a payload of social profile data can turbocharge those services from the first moment a new user visits a site.
Customer Lifecycle Data
Social profile data can also be used to predict customer lifecycle. Imagine knowing not only if a customer has children, but the exact ages of those children. In addition, key indicator purchases, like buying diapers for the first time, indicate a customer entering a new lifecycle. Other key indicators, like shipping address changes, first purchases of furniture, or first purchases of substantially higher-value goods can all indicate the start of a new customer mentality and behavior pattern.
These patterns are predictable, so you know the future behavior of high school seniors by looking at the current behavior of college freshmen. By using demographics alone, all high school graduates would be marketed to identically. Using psychographics, we know who is likely to be interested in specific product or content recommendations at a specific time — such as when they actually start their first day of college.
This vision is starting to gain traction among serious marketers. At the 2009 Internet Strategy Forum, Xerox’s VP of Interactive Marketing, Duane Schulz, said that a 1% clickthrough rate was a huge failure — even though it is 10 times the industry average. In his mind, a successful campaign would never waste 99% of its impressions. Using psychographic data, you don’t have to waste any impressions.
We have seen a similar upheaval in marketing before. In the 1960s, marketers who embraced the power of television, broad-based insights into psychology and demographic data created world-class brands and billions of dollars in value. At that time, if you didn’t advertise on TV, you lost. Today’s new tools offer a similar choice: Build a deep understanding of your customer, or risk irrelevance.


via mashable.com

Have social media networks reached a saturation point? (According to search volume)
The Taste Graph is the foundation that powers Hunch’s predictions. It is the growing, constantly-improving, massive data structure that fuels not only Hunch.com, but also partner site customization and our open API.
Our latest Infographic takes a deeper look at Hunch’s Taste Graph: what it takes to produce it, what goes into it, and how it works. And once again, our thanks to the awesome team at Column Five Media who designed this Infographic.

via blog.hunch.com
Did you know that out of all social networking users 92% partake in Facebook, 29% participate on MySpace, 18% are on LinkedIn and Twitter is the least utilized network with just 13% usage? Or that males on LinkedIn nearly double the number of females, yet female usage of Twitter almost doubles male usage?
Today Pew Internet & American Life Project, a project of the Pew Research Center, launched a detailed report on how social networking affects our lives that contains these results and
more surprising information. The report includes a wealth of information from whether or not social media is making people less social in real life to detailed demographic data about U.S. usage of each network.
The goal of this report was to discover what social networking is actually doing to people in their personal offline lives. These are the highlights and conclusions from the 80+ page report.
Who Uses Social Media Networking Sites?
Some of the initial information that Pew Internet presents relates to the social user and who they actually are by age, race and gender.
One of the most weighty stats about social networking usage is the fact that overall social networking usage has nearly doubled from 2008 to 2010. Back in 2008 26% of adults were utilizing a social networking service (SNS) whereas 47% of adults were using a SNS in 2010.
Age
Leading the increase in social networking usage were those over the age of 35, which grew nearly twice as fast as those 18-35 in the same time period. Only 18% of Internet users over the age of 35 used a social networking service in 2008 and by 2010 that number was up to 48%. The average age of an adult SNS user jumped from 33 years old in 2008 to 38 years old in 2010
Gender
Typical to similar studies the report backs up the fact that social networking users skew female. A notable change showed the discrepancy actually grew from 6% more females in 2008 to 12% more female social networking users in 2010:
Site-by-Site Breakdown
One of the most interesting elements of the report is the site-by-site statistics that showed who actually uses the various social networking sites.
Age
A few surprising stats arose from these findings, including the fact that the average MySpace user (32 years old) is younger than both the average Facebook user (38) & Twitter (33) user. LinkedIn skews the highest out of all the networks with users having an average age of 40.
Gender
LinkedIn is the only social network that has more men than women and the disparity is rather large with men nearly doubling the number of women. Twitter, on the other hand is almost exactly the opposite of LinkedIn with woman making up 64% of the total users.
Race & Ethnicity
The information contained in the report shows that the vast majority of social networking users in the U.S. are white; the lack of minority participation on most networks is staggering.
African-American users have the lowest presence on LinkedIn making up only 2% of the total users. The highest saturation of African Americans is on MySpace with 16% of the total users.
Hispanic users are not prominent on social networking services either. LinkedIn is comprised of only 4% Hispanics, compared to the approximate 14.5% Hispanic makeup of the national population. Hispanics do however make up 12% of both the Twitter and MySpace user base.
LinkedIn is far and away the most saturated site when it comes to white users who make up a whopping 85% of the user base.
Social Networking Usage
Much of the information that Pew Internet uncovered about social usage was expected like MySpace having users who have been members the longest, Twitter having members for the shortest time lengths, but there was some interesting data in regards to everyday usage.
The main finding in regards to usage is that Facebook is far and away the most popular social networking site. Other sites don’t come remotely close to the popularity of Facebook. Of all users on social networks, 92% use Facebook, 29% use MySpace, 18% use LinkedIn and just 13% use Twitter. That’s right, people who have a social networking account are least likely to use Twitter.
Frequency
While Twitter finished in last place out of the main 4 sites the frequency of use of Twitter is quite high. Facebook again leads the pack in frequency of use with 52% of users checking at least once a day, but Twitter is close behind with 33% of users on the service daily:
Facebook Statistics & Usage
Facebook is a focus of this report and thorough usage data and user behavior is included throughout.
Facebook users are quite active in not only using the service, but interacting with others.
- 22% of users comment on another’s post or status
- 26% of users “like” another user’s content
- 15% of users update their own status
- 20% of users comment on another user’s photos
The most active Facebook users tend to be women. 19% of women update their status at least once a day, while men are about half that number (11%) when it comes to daily status updates:
In addition to commenting and updating statuses, Facebook users do “like” quite a bit of content.
- 44% of users in the 18-22 age range “like” content on a daily basis.
- Men are less likely to “like” Facebook content than women. 20% of women “like” content several times a day compared to just 9% of men.
Breakdown of Friend Relationships
In addition to usage, the report sheds light on the what the most common makeup of Facebook friends might be.
- 22% people from high school
- 12% extended family
- 10% coworkers
- 9% college friends
- 8% immediate family
- 7% people from voluntary groups
- 2% neighbors
Does Social Networking Hinder Real-Life Social Experiences?
The biggest question that Pew Internet wanted to answer with this report was whether or not social networking hindered off line activity and interactions. The answer is clear, it most certainly does not. Not only do SNS fail to retard offline growth, they actually help users develop connections and form stronger relationships in the real world.
Some of the most interesting stats that prove social networks are more than just online relationships are:
- Only 3% of users’ Facebook friends have never met in person. While 89% of all Facebook friends have met in person more than once.
- Internet users have a much more diverse network than those who don’t use the internet. Out of all social networks, LinkedIn users have the most diverse networks.
- The average user of a social networking site has more close ties than a non-Internet user and is half as likely to be socially isolated as the average American.
- Internet Users are more trusting of others than non-Internet users. Facebook users are over 3 times more likely than non-internet users to agree that “most people can be trusted.”
- Social networking users may have more of a life than non-internet users. There is a higher percentage of SNS users to partake in a community group, sports league or youth group than a non-internet user.
Other Interesting Learnings
- Private messages are not frequently used. Only 38% of users claim to use Facebook’s private messages at once a week or more.
- MySpace users have a greater probability to take multiple viewpoints than any other social networking site.
- Internet users are more likely to know their neighbors’ names than non-internet users
- LinkedIn is the only platform that skews male. Nearly twice as many men (63%) as women (37%) use LinkedIn. All other SNS platforms have significantly more female users than male users.


If the world were a village of 100 people, how would the composition be? This set of 20 posters is built on statistics about the spread of population around the world under various classifications. The numbers are turned into graphics to give another sense a touch – Look, this is the world we are living in.
- via Toby Ng
I’d like to share a brief demographic analysis of social networks that helps explain who uses social networks, and for what purpose.
Before diving in, I think its best to discuss where our data comes from. Amzini is a directory of over 900 social websites that are visited over 7 billion times per month, by over 900 million visitors (Compete.com). We collect demographic information on each website from Alexa.com, who uses their toolbar to provide estimations of the audience's composition for each site. On an individual site level, these statistics often must be taken with a grain of salt due to small sample sizes and Alexa's bias towards the technologically saavy crowd. However, since our statistics are deduced from 900 websites that average 9 million visits/month per site, our demographic figures provide a unique and informative new look into the social networking industry.
The demographic averages for our entire data set tell a familiar story; social networking is dominated by younger generations with no children, and online networking activity picks up in college. Now that I told you what you already know, let’s look at a categorical breakdown and heat-map featuring demographic data separated into Amzini's 11 main categories.
Age
As a whole, we see exactly what we expected... social networks are most popular among the youngest generation (18-34) and are used less frequently for each successive age group over 35. This trend is often attributed to an increased likeness for technology among youth. However, the heat map to the right highlights the important role generational differences in interests plays in creating such a young social networking demographic.
Youth ages 18-24 tend to use social networks to supplement social life, learning, and having fun. These happen to be the three strongest suits of social networking. The categories that are most popular among this age group are Friends/Dating (social life), info-sharing/education (learning), and creative arts/gaming (having fun). Combined, these 6 categories make up about 91% of the total visits per month among sites on Amzini!
The most diverse use of social networks comes from the 25-34 year old age group. This demographic tends to continue to use the services they used in college, but less often. However, as they start to have new interests (business, family), the data suggests this is the age group most likely to use online social engagement to benefit their business/career, discuss or plan travels, and share family-related experiences online.
For the demographic above 35, there is clearly some technological bias against social networking. However, the reasonably high likeliness of these age groups to use business, family, and dating networks suggests that social networking's popularity among youth may be not just be due to technological differences, but to a better fit of interests.
Questions
Social options are becoming available for more and more new interests... Do you think these networks are entering in response to a more diverse market? Or do you think the market is diversifying due to innovations that make social engagement valuable for a more diverse set of needs?
Education
The participation rate for social networks across the board tends to be higher for people with college-level education. In college, your network expands beyond your hometown and there is a tremendous amount of information shared between students. As mentioned before, social networking is a great fit for these needs, so the high use among people with college education is not surprising.
Two categories break this trend. The first, Gaming, has an unusually high participation rate among people without college experience. With an extraordinarily young following, it is likely that a high percentage of gamers are simply too young to have college experience.
The second trend-breaker, Places, has a very high participation rate among people with graduate-level schooling. This statistic can likely be attributed to the positive correlation between graduate school and income, and between income and travel.
Questions
Does it surprise you that Gaming is the only category where social networks are used more often than other sites among people with no college experience?
Gender and Children
A social network's gender is probably the demographic most strongly influenced by the community's niche. Many categories present data in line with stereotypes... Gaming is strongly dominated by males, lifestyle and family by females. There are, however, some surprises here. Dating, Places, and Business actually are used more often by females while education networks are used most by males. Are these as you expected?
The dominance of a population without children is likely strongly influenced by the correlation between age and having children. It is also likely that older generations have a decreased need to meet new people as they settle down and have kids. The obvious exception to this trend is the 'Family' category, for which having kids is often the primary reason for participation in the first place.
Browsing Location
The heat-map of browsing location reveals strong use of social networks in the workplace. This raises an interesting debate. On one hand, strong engagement with social networks at work may suggest social networking is becoming a distraction in the workplace. On the other hand, this engagement may be representative of the increasing application of social websites for practical purposes (beyond socializing with friends).
Social networking is becoming a growing asset to businesses as both a marketing and a communication tool. While extremely strong numbers for the Business and Places categories likely reflect this use, you have to wonder if lifestyle, friends, and interest networks are being used in a social context rather than just for marketing purposes.
Questions
What do you think about the use of social internet at work? Do these numbers reflect a growing importance of online communities for businesses? Or are social networks becoming a distraction for workers?
We've given some brief interpretations of this interesting data set, but there are many interesting topics of discussion that we have not covered. What story stands out to you?


