-via columbia.edu
-via columbia.edu

The world's population is expected to hit seven billion in the next few weeks. After growing very slowly for most of human history, the number of people on Earth has more than doubled in the last 50 years. Where do you fit into this story of human life? Fill in your date of birth below to find out.

Search all of New York City's affordable housing by name, owner, year built, location, financing or physical information (for example by # of building violations in 2010). Or, you can research all sorts of demographic information from Crime to Education to employment to health to all sorts of housing informtion, to property tax to population, ethnic demographics and transportation.
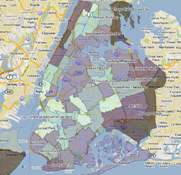
The Furman Center for Real Estate and Urban Policy collects a broad array of data on demographics, neighborhood conditions, transportation, housing stock and other aspects of the New York City real estate market. We make our data directly available to the public through our new Data Search Tool, and publish comprehensive analyses of these data in our periodic reports.
The Data Search Tool is a new online application that provides direct access to New York City data collected by the Furman Center. Users can select from a range of variables to create customized maps, download tables, and track trends over time. Users are able to overlay never-before available information on privately-owned, publicly -subsidized housing programs collected through the Furman Center’s Subsidized Housing Information Project (SHIP). Information about how to use the Data Search Tool is available in our online guide.
From the Furman Center


From the creators of the Twitterverse 2.0

This map distills more than 4000 moves from over 1700 people, collected in an informal survey by WNYC, a New York based public radio station.
For generating the geo–coordinates from the entered ZIP codes, I used the free bulk geocoder at gpsvisualizer.com. I did not check every single data row in detail, so a few of the moves might be misrepresented.
 Actually, it is consists of two overlaid circles: a red one for people moving out of the area, and a blue one for people moving to the area. So, a small purple circle with a thick blue outline indicates a place where people tend to move and stay, whereas a red outline indicates a less attractive place.
 You can directly compare the lengths of the red (for people moving away from the selected areas) and blue (for people moving to the selected areas) bars to spot trends and peculiarities. Moreover, you can compare these values to the baseline (overlaid in grey), which indicates the relative proportion when we consider at all moves. If, for instance, the blue bar for "landlord issues" is smaller than the red bar, this means that the selected area has a relatively low fraction of people moving away because of landlord issues.
I just was invited to Qwiki Alpha, the interactive, "information experience' platform that creates multimedia-rich wikis algorithmically out of data sets, instead of by user input and peer review!
Despite simply being fascinating and amazingly cool, Qwiki has profound implications upon the future of search and data organization.
Please note that according to Qwiki:
1. This experience was not generated by humans. It was generated by machines.
2. This experience is completely curated.
3. The experience is completely interactive
I had written about how exited I was about the possibilities of Qwiki a few weeks ago, but apparently they have now launched the Alpha version to select users. Also on Friday, Qwiki also announced a round of funding from tech-celebs Eduardo Saverin (Facebook co-founder) and Jawed-Karim (YouTube co-founder).
I cannot wait to test this out more, but see below for an entirely computer generated entry about the word "Wiki."